The Gantt Chart: an Invaluable Project Management Tool
Overview
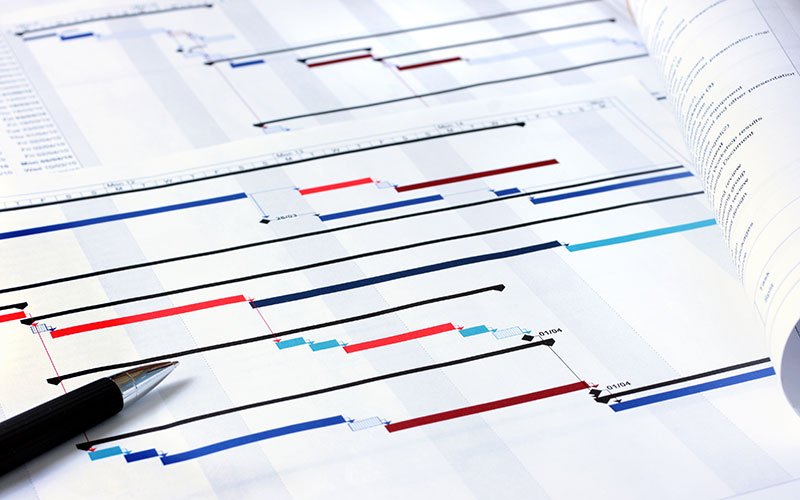
1. What is a Gantt Chart?
The Gantt chart is named after the system invented by Henry Laurence Gantt to control work performance. It represents the schedule of a project using bars over a timeline. Thus, Gantt charts are also called bar charts. What makes a Gantt chart different from a timeline diagram is that Gantt charts also represent dependencies between tasks. Using Gantt charts is among the project management methods you need to know.
A Gantt chart documents the current and planned project flow over time. It presents the process elements – i.e. tasks and milestones – in an easily recognizable way. It takes into account interrelationships, constraints, and dependencies, while displaying a start date, duration, and end date.
The basis for a Gantt chart is usually a project structure plan (PSP). For smaller projects, we often avoid using a PSP and instead create a work breakdown structure (WBS) directly in a Gantt chart.
When activities in our Gantt charts don’t directly result from a WBS, then they come from work packages within the project structure plan. A work package is usually divided into a series of activities; however, the reverse is also true in some cases.
2. Advantages of a Gantt Chart
- Gantt charts are easy to understand, even for laymen.
- They give us a quick overview of project activities and processes.
- Bar lengths show us immediately project duration.
- Connecting lines represent relationships between activities.
- We can quickly see the current status of a project.
- Buffer times can be easily identified.
- Critical activities or processes are shown.
3. Elements of a Gantt Chart
A Gantt chart usually consists of projects, tasks, and milestones, as well as dependencies. We’ll take a look at dependencies a little later.
Projects
A core feature of the Gantt chart is the possibility to arrange elements hierarchically. Projects or sub-projects are located on the highest levels. These are subdivided into subordinate activities or products. In a classic project, for example, there are activities for the individual phases, such as planning and implementation. In an agile project, the Gantt chart below the project level would be divided into release and sprint activities.
The expected time frame of a project is derived from the start and end dates of the activities it contains.
Processes
Processes, also known as activities or operations, summarize work units, such as work packages (tasks). Activities must be able to be broken down into sub-activities at any depth. It is often helpful to use the results (products) resulting from these operations instead of real operations and activities. The advantage: it is easier to check whether a product is really finished than to determine whether enough has been done.
Tasks usually have a start date, a duration date, and an end date. In many tools, the current work progress is shown by coloring the operation bar.
Milestones
Milestones mark the completion of a phase or stage in the project. Therefore, they represent goals that you have already achieved in the project or that you are striving towards. Milestones are indicated by a diamond in the Gantt chart. In many tools, tasks with a duration of zero are interpreted as milestones.
4. Creating a Gantt Chart
A bar chart is based on a work breakdown structure that you have previously created, either as a mind map or with project management software. In this plan, you have divided the project into tasks (subprojects, subtasks, and work packages). This way you know which tasks have to be completed and which products (work results) have to be delivered. With a Gantt chart, you can plan the time duration and the dependencies of the tasks.
If you want to create a Gantt chart for your project, make sure to do the following:
- Identify all important tasks in the project by creating a work breakdown structure.
- Determine the duration of the tasks.
- Define the control feet by determining the relationships of the tasks to each other.
Task Duration and Critical Paths
The duration of the activities and work packages determines the bar length. Bars of individual tasks may overlap in the Gantt chart. We recommend that you plan buffer times between activities. If tasks affect the end of the project, and there are no buffer times between them, then there is a critical path. If something is delayed there, the project end will also be delayed. You may already know this concept from networks.
5. Dependencies
Some tasks can only start when others are finished, or they are dependent on the start of another activity. You must also include these linear relationships in the Gantt chart. There are four different types of relationships for linear tasks:
- End to Start: You can begin a task as soon as a prior one is finished.
- End to End: You can end a task once a prior task is finished.
- Start to Start: You can start a task once a prior one has been started.
- Start to End: You can end a task as soon as a prior one has been started. This is rare.
Of course, it’s best to run as many tasks as possible parallelly, but being able to do so is a question of available resources and how long it takes to complete a project.
Once the dependencies have been defined, modern project management tools can take this into account when moving deadlines. If a task is postponed, all the deadlines that depend on it are also postponed accordingly.
6. Controlling Projects
A Gantt chart is a proven control tool in project management – after all, this representation has been around for over 100 years and is still popular!
That’s no surprise. Gantt charts are easy to create and provide a quick overview of the status of your project. But do you want to draw a bar chart by hand like the inventors once did? Use a tool that gives you a template for creating bar charts and makes it easy to define dependencies between tasks. If you need to adjust the plan, you only need to move the corresponding activities or work packages in the Gantt chart – the tool will perform all further calculations, so that you can, for example, recognize critical operations right away.
Allegra project management software fully supports Gantt charts.
Want More Project Management Information?
Here’s an interesting article about 10 project management best practices.