Budget Overview
The tile “Budget Overview” gives you a quick overview of the current project or release status. In a table, you can see summaries for all overdue items, items due this week, items due next week, and all remaining items.
For each category, you can see the estimated remaining work, the percentage of completion, and the actual work associated with the planned value. The tile can be customized with respect to various aspects such as project, priority, state, and release.
This tile needs to be configured to show something.
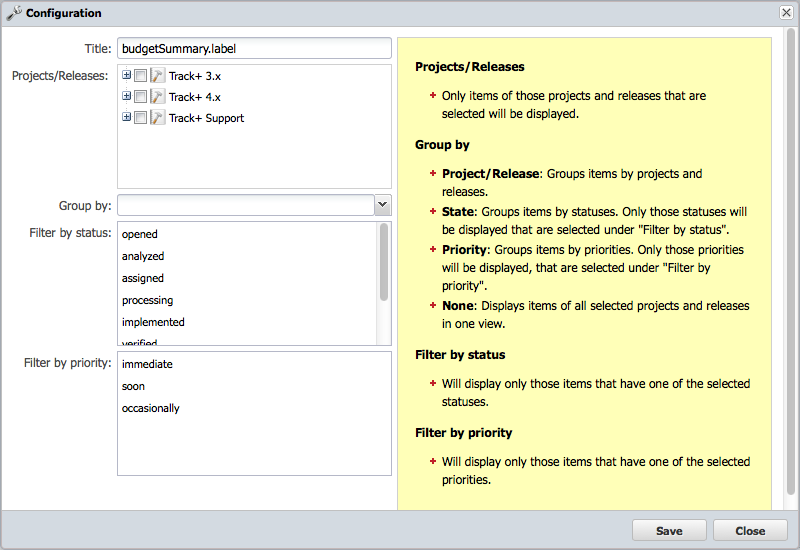
You can select the project and/or releases you want to include in the budget overview. If you select only the project, all releases of this project will be considered.
You can group the overview according to different criteria. Grouping is possible for the following:
Project and release - for an overview and for each selected project or release;
Task state - for an overview and for each selected state;
Task priority - for an overview and for each selected priority;
None - for an overview without grouping.
In addition, it is possible to apply a filter to view only a subset of items, for example, only items with a certain state or priority.
Default tile
The following figure shows the standard page frame with a single release of a project and no grouping.
On the left, you can see the four time-based categories of overdue, due this week, due next week, and all others. All others mean that they either have no due date or the due date is after the end of next week.
Each time category is divided into items that you process yourself, items for which you are registered as the manager, and all items. The “all” line includes the previous two lines.
Completion is calculated as the sum of posted work and estimated remaining work. Note that the original planned value is not taken into account when calculating completion.
The right column shows how much of the original planned work has already been spent. If this value exceeds the completion, the project will most likely be more expensive than planned.
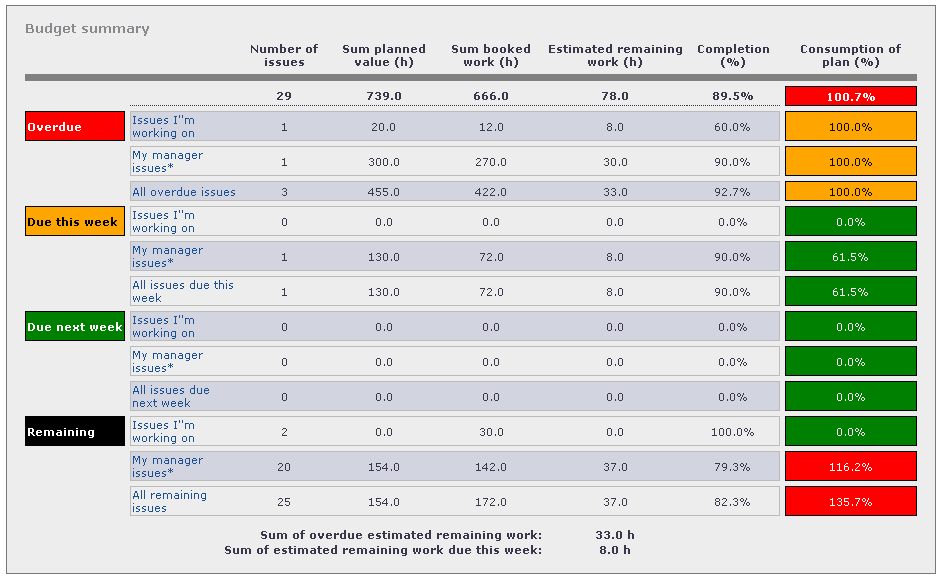
At the bottom, two more numbers are displayed. The first number gives an indication of how far behind schedule a project is.
The second number gives an indication of how well a project is doing if you only look at the current week. When this number is close to the number of people currently working on the tasks that are due times the number of hours remaining in that week, the project is pretty much on schedule.
Grouped by priority
As mentioned above, you can group the budget summary by various criteria. The following figure shows a grouping according to priority.
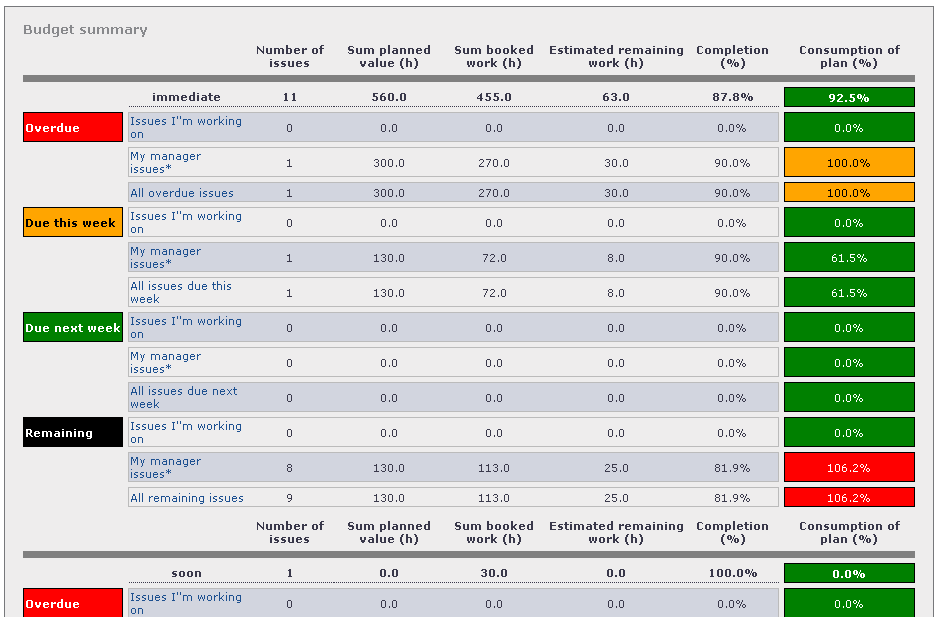
The grouping value is displayed in the heading of the second column from the right.
You can restrict the priorities displayed by applying an appropriate priority filter in the configuration of the budget overview. For example, you can monitor only the tasks with high priority and disregard those with a lower priority.
Grouped by state
This tile is the same as the one for grouping by priority, except that the state values are also displayed.
You can adjust the states displayed by applying an appropriate state filter in the budget overview.