Milestone Trend Analysis
This graphical cockpit tile allows you to monitor the development of important items over time.
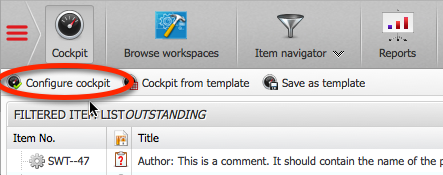
Before you can use this tile, it has to be configured. Switch to the cockpit and click on the button “Configure cockpit”.

Follow the general procedure to configure the described cockpit, see Working with the Cockpit.
From the list of cockpit tiles at the bottom right, choose “Milestone Trend Analysis” and drag it to the desired position in the cockpit.
Then right-click on the new tile and select configure.

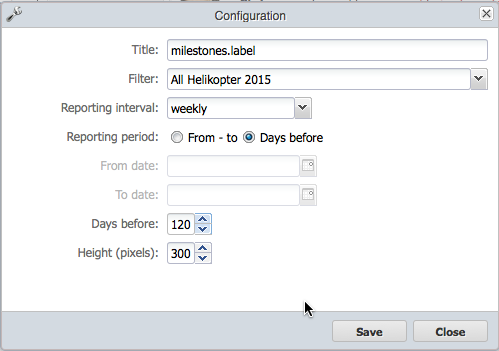
You then select a filter that gives you only the items (milestones) you are interested in.
Then you specify the report interval. For example, to display the date of the item as it was published at the end of each week, select weekly.
Now you define the reporting period, e.g., from the beginning of a project to its end.