Project Overview
This tile gives you an overview of your projects and releases. You can configure which projects and releases you want to include. You can group the items according to different aspects, e.g., by priority, task status, current responsible person, etc. As with all other views, you can, of course, have several instances in your cockpit, for example, one grouped by person responsible and one grouped by status.
Configuration
Before you can use this tile, you must configure it. Follow the general procedure described above for configuring a tile to get to the configuration page for the Project Summary page.
You can change the description of the tile to give it a more specific meaning. This is especially helpful if you use more than one instance of this tile in your project, for example, one grouped by state and one by responsible.
You can select which projects and/or versions you want to include in this tile. If you select a project, all versions of that project will be included.
Lastly, you need to select the grouping criterion. You can group by:
Item type: allows you to see the distribution between different item types such as tasks, tickets, etc.
Task status: allows you to monitor the progress of the project
Current Manager: gives you an indication of the workload of the managers
Agents: gives you an overview of the workload of your team
Priority: gives you an indication of the number of urgent items
Impact: shows you the number of critical items
Author: indicates who created how many items
Save your configuration by clicking on the “Save” button. You will return to the Tile configuration. Click the “Back” button in the toolbar workspace to complete the configuration.
Display
The “Project Overview” tile shows you the number of items, grouped by projects and/or releases, and a second grouping criterion that you have chosen for this tile.
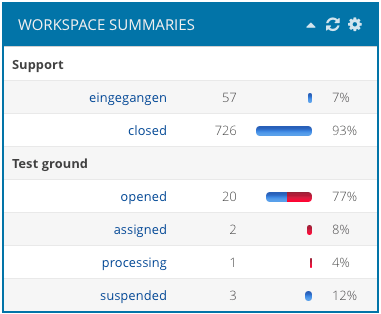
The number of items in each category is given as an absolute number as a percentage of the total number of items for that group and visualized in the form of a bar chart.
Late items are highlighted in red in the bar chart. You can click on one of the category descriptions (for example, a specific state in a specific version) to see the list of items for that category.